This is not the first piece of statistical, predictive modeling crap to come out the Federal Reserve.
The last time they used University of Southern California.
Learn more: BEVERLY TRAN: Federal Reserve Published TARP Propaganda To Cover Up Fraud http://beverlytran.blogspot.com/2017/07/federal-reserve-published-tarp.html#ixzz5RPyYHTKk
Stop Medicaid Fraud in Child Welfare

As much as I respect my alma mater, this has got to be one of the dumbest studies I have seen since that other Federal Reserve hit study on whether or not the banks benefited from TARP.
It is not even peer reviewed because it is a working paper.
Who paid for this study?
Russell Sage Foundation (grant # 94-16-04)
National Institute of ChildHealth and Human Development (NICHD) grant #1R01HD081129
Did you know the NICHD is really called the Eunice Kennedy Shriver National Institute of Child Health and Human Development and they are the ones who make the policies to traffic tiny humans?
This looks like a Public Private Partnership, or rather, I smell the work of Jerry Milner.
How much was this study?
Anything over the price of a 40 ounce brew and a spleef was too much.
Was this study paid with tax dollars and if so, how come I have to pay to access a public document, submitted into state and federal records, used to justify the use of more tax dollars, specifically Medicaid, when there is absolutely no mention of Medicaid fraud, or perhaps there is, if I pay for the study?
https://www.sciencedirect.com/science/article/abs/pii/S0047272718300707
Guess what, I got the document.
THE ACA MEDICAID EXPANSION ... by on Scribd
How come a public document which has been generated with public dollars, prescribing social and economic policy recommendations, has a copyright?© 2018 by Sarah Miller, Luojia Hu, Robert Kaestner, Bhashkar Mazumder, and Ashley Wong. All rights reserved. Short sections of text, not to exceed two paragraphs, may be quoted without explicit permission provided that full credit, including © notice, is given to the source.I am taking this moment to call out Fair Use on the BS copyright because my site is not monetized, I am preserving the annals of history, and I have just formally enter this into my case as evidence, so if anyone has a problem, then you are going to have to motion up.
Why was an undergraduate student running this study?
This work was supported by the National Institutes of Health [1R01HD081129-01]. The views expressed here do not represent the views of the Federal Reserve Bank of Chicago or the Federal Reserve System. We thank Sharada Dharmasankar for her excellent research assistance. We also thank the editor and four referees for helpful comments.
They used her. They are cranking out their armies through the universities to keep this Public Private Partnership going until they achieve world domination for their glorious leaders who give them pretty shiny sheep skins.
Who was the principal on the study?
"I see Corporate Shape Shifters. Was it Michigan? Was is Sage Foundation? Was it Gates Foundation? Was it the Federal Reserve? Was it the National Bureau of Economic Research? Was it the National Institution of Health? Who is making policies for "The Poors" (always said with clinched teeth). Mommy, who owns our data, I'm scared."
Why was individual data sold to a private organization, who authorized it?
Cui bono?
Second, data from TransUnion on consumer credit histories was matched with the Healthy Michigan administrative data using name, address, and social security number. TransUnion credit reports were observed twice per year, in January and July, starting with July 2011 and ending with January 2016, resulting in ten observation periods. Prior to providing the matched data to the researchers, all personally identifying information was removed. See the Appendix for additional details on the match process. page 7.
Oh, wait, Michigan Department of Health and Human Services.
Yes, they sold the data.
We are grateful to the Russell Sage Foundation (grant # 94-16-04) for support of this project. Drs Kaestner, Mazumder, and Miller also benefited from support from the National Institute of Child Health and Human Development (NICHD) grant #1R01HD081129. We thank Tara Watson, Lara Shore-Sheppard, seminar participants at the Federal Reserve Banks of Philadelphia and Chicago and conference participants at ASHEcon for their comments. We also gratefully acknowledge the Michigan Department of Health and Human Services for making this data available, Sarah Clark and Lisa Cohn for helping assemble the MDHHS data set, and Dave Fogata for facilitating the data purchase from TransUnion. The views expressed herein are those of the authors and do not necessarily reflect the views of the National Bureau of Economic Research.They now have a viable voting database for manipulation.
Did you know Sharada has her name on another piece of crap Federal Reserve of Chicago study on the financial health of people who lost their homes to fake ass mortgage foreclosures?
Now, you do.
Her other crappy Federal Reserve study, below, failed to identify the fake ass mortgage fraud in Detroit.
In the spirit of fuchsia...
Study: Expanded Medicaid boosted finances of Michigan's poor
Enrollment in Michigan's expanded Medicaid program boosted the finances of many low-income residents as well as their health care status, according to a University of Michigan study released Monday.
It is always wise to keep your chattel alive to maximize revenues my making sure to layer up services, upon administrative fees, to implement studies for more service programs, to service for "The Poors" (always said with clinched teeth.)
Can you see the $ocial Impact Bonds? I can.
It is always wise to keep your chattel alive to maximize revenues my making sure to layer up services, upon administrative fees, to implement studies for more service programs, to service for "The Poors" (always said with clinched teeth.)
Can you see the $ocial Impact Bonds? I can.
Among more than 655,000 residents who gained health coverage after the Legislature approved the Healthy Michigan Plan in April 2014, many have experienced fewer debt problems and other financial issues than before enrollment, according to the analysis of thousands of enrollees' financial records.
If you did not know, they used aggregate data. They should know very well the biases with MAUP, duh. This means the entire study sucks.
If you did not know, they used aggregate data. They should know very well the biases with MAUP, duh. This means the entire study sucks.
The study found drops in unpaid debts, such as medical bills and overdrawn credit cards, as well as fewer bankruptcies and evictions after people enrolled in Healthy Michigan. The program provides health insurance for adults with incomes up to 133 percent of the federal poverty level.
You can already tell that they did not use Detroit data. Do you know how many homes were foreclosed upon based on fake property taxes and mortgages in 2012 in Wayne County?
You can already tell that they did not use Detroit data. Do you know how many homes were foreclosed upon based on fake property taxes and mortgages in 2012 in Wayne County?
The research team was led by economist Sarah Miller of UM’s Ross School of Business. Their finding were published Monday on the website of the National Bureau of Economic Research with colleagues from the Federal Reserve Bank of Chicago, University of Illinois, Chicago and Northwestern University.
Yeah. I truly hope Sarah does not get tenured for this crap.
Yeah. I truly hope Sarah does not get tenured for this crap.
The greatest financial gains were experienced by people with chronic illnesses or who had a hospital stay or emergency department visit after they enrolled.
“Across the board, we saw a pretty sizable effect, not just on unpaid medical bills, but also unpaid credit card bills, and on public records for evictions, bankruptcies, wage garnishments and other actions,” said Miller, a member of the UM Institute for Healthcare Policy and Innovation.
ASSUMPTION RULEOUT #1: When you are sick and broke, you cross your fingers you get approved in 3 to 5 years for a SSI check. That means you are poor and do not have credit, so there would be no credit card debt.
ASSUMPTION RULEOUT #1: When you are sick and broke, you cross your fingers you get approved in 3 to 5 years for a SSI check. That means you are poor and do not have credit, so there would be no credit card debt.
“Enrollees’ financial well-being seems to improve when they can get the medical care they need without having to put it on a credit card. And the largest effects are among the sickest enrollees.”
ASSUMPTION RULEOUT #2: "The Poors" (always said with clinched teeth), do not have credit. Most of the time, all they have to do is miss one week of work and they will automatically qualify for Medicaid. Have you looked at the rates of poverty, lately? $1.00 over the threshold and you are cut off.
ASSUMPTION RULEOUT #2: "The Poors" (always said with clinched teeth), do not have credit. Most of the time, all they have to do is miss one week of work and they will automatically qualify for Medicaid. Have you looked at the rates of poverty, lately? $1.00 over the threshold and you are cut off.
The team worked with the Michigan Department of Health and Human Services to obtain data on more than 322,000 enrollees without the researchers’ having access to any individual’s identifying information. Using a double-blind matching procedure, they matched the data with enrollees’ credit reports, and studied them as a group.
ASSUMPTION RULEOUT #3: They lied. How are you going to obtain metadata then run it in a double-blind with credit reports. Seriously? You already know whatever they crank out is going to be on dirty data. I wonder if they excluded the areas of Flint, Detroit, and the middle swath of the state, you know, the land of "The Poors" (always said with clinched teeth).
ASSUMPTION RULEOUT #3: They lied. How are you going to obtain metadata then run it in a double-blind with credit reports. Seriously? You already know whatever they crank out is going to be on dirty data. I wonder if they excluded the areas of Flint, Detroit, and the middle swath of the state, you know, the land of "The Poors" (always said with clinched teeth).
The study focused on people who enrolled during the first year of the Healthy Michigan plan, and who had previously been uninsured. Researchers looked at individual-level financial information from several years before each person enrolled, and for at least one year following enrollment.
The average household income for enrollees in the study was $4,400 for an individual and $7,500 for a family of three. Seventy percent had a chronic illness, and on average they had been to an emergency department once in the past year.
Ah, this is where asset forfeiture policies kick in through guardian ad litems and those wonder corporate parents. When someone has an average income between $4K and $7K a year, you are probably correct to assume that these individuals were probably in foster care or living in a boarding home and are dealing with mental health issues.
Ah, this is where asset forfeiture policies kick in through guardian ad litems and those wonder corporate parents. When someone has an average income between $4K and $7K a year, you are probably correct to assume that these individuals were probably in foster care or living in a boarding home and are dealing with mental health issues.
“A goal of the Healthy Michigan Plan is to address social determinants of health in order to promote positive health outcomes, greater independence and improved quality of life," said Lynn Sutfin, a spokeswoman for the Michigan Department of Health and Human Services.
HOW TO PROMOTE POSITIVE HEALTH OUTCOMES: Stop making "The Poors" (always said with clinched teeth), poorer!
HOW TO PROMOTE POSITIVE HEALTH OUTCOMES: Stop making "The Poors" (always said with clinched teeth), poorer!
"This study shows that ensuring Michigan residents have access to quality, affordable health care is reaping numerous benefits.”
No, this study shows another fraud scheme to hustle more money through privatization schemes to shore up the Federal Reserve banks that are going insolvent, like Deutsche Bank. This is propaganda and I am repulsed that this is the University of Michigan is promoting more insurgency propaganda for the purposes of the Privateering NGOs to swoop in and commence to stealin' through more crappy predictive modeling social programming for the parent corporations. That is the only place the financial health is focused.
No, this study shows another fraud scheme to hustle more money through privatization schemes to shore up the Federal Reserve banks that are going insolvent, like Deutsche Bank. This is propaganda and I am repulsed that this is the University of Michigan is promoting more insurgency propaganda for the purposes of the Privateering NGOs to swoop in and commence to stealin' through more crappy predictive modeling social programming for the parent corporations. That is the only place the financial health is focused.
More than 80 percent had credit scores in the subprime or deep subprime range. Their total debt in collections, medical debt in collections and past-due amount was higher than a random sample of credit reports nationally.
Uh...it is called poverty.
Uh...it is called poverty.
According to the study's findings, the Healthy Michigan Plan reduced their medical bills in collections by an average of 57 percent, or about $515. The amount of past due debt not yet sent to a collection agency was reduced by 28 percent or about $233.
How much of this past due debt was based upon bogus water bills or fake mortgages?
How much of this past due debt was based upon bogus water bills or fake mortgages?
Researchers found a 16 percent drop in public records for evictions, bankruptcies, wage garnishments and other financial events. Bankruptcies dropped by 10 percent among the group studied.
Most individuals do not have enough debt to file bankruptcy. You cannot get evicted is you are homeless. There would be no wage garnishments if you already hail from "The Poors" (always said with clinched teeth).
Most individuals do not have enough debt to file bankruptcy. You cannot get evicted is you are homeless. There would be no wage garnishments if you already hail from "The Poors" (always said with clinched teeth).
Enrollees’ were 16 percent less likely to overdraw their credit cards, and their credit scores improved as a group. The number with a “deep subprime” rating fell by 18 percent, and the number listed as “subprime” fell by 3 percent.
Do you mean those deep subprime mortgages that stole the houses from the people, allowing for gerrymandering of congressional districts for the purposes of putting in elected spokestokens to approve crappy studies like this to get more Medicaid money for stealin'?
Do you mean those deep subprime mortgages that stole the houses from the people, allowing for gerrymandering of congressional districts for the purposes of putting in elected spokestokens to approve crappy studies like this to get more Medicaid money for stealin'?
Enrollees experienced a 21 percent rise in automotive loans, an indication of improved financial well-being.
No, no, no. This is Michigan, the land of cars and corner car lots where Mohammad will sell you a hoopty and get you that 7 day insurance to get your plates to get on the road to find a good low-paying job and still qualify SNAP benefits.
No, no, no. This is Michigan, the land of cars and corner car lots where Mohammad will sell you a hoopty and get you that 7 day insurance to get your plates to get on the road to find a good low-paying job and still qualify SNAP benefits.
According to Miller, other studies have found that Medicaid expansion reduced use of payday loans and reduced interest rates for low-income people.
Did Debbie Wasserman Schultz tell you to throw that "Medicaid expansion reduction in the use of payday loans and reduced interest rates for "The Poors" (always said with clinched teeth). I someone in your targeted population gets a payday loan, it is because they have a SSI check as collateral.
Now, nine years after the onset of the housing bust, we think it is worthwhile to assess the financial health of the individuals whose homes were foreclosed on during this period. Have they regained their financial footing, or are they permanently scarred? How different were their experiences compared with those of borrowers whose homes were lost to foreclosure in the years before the Great Recession? Did their experiences differ by their financial success (as reflected in their credit scores) before the Great Recession? And how likely are they to have undertaken a new mortgage?
Did Debbie Wasserman Schultz tell you to throw that "Medicaid expansion reduction in the use of payday loans and reduced interest rates for "The Poors" (always said with clinched teeth). I someone in your targeted population gets a payday loan, it is because they have a SSI check as collateral.
2016
Have Borrowers Recovered from Foreclosures during the Great Recession?
By Sharada Dharmasankar ,
As a result of the severe decline in the housing market and the financial crisis during the last economic downturn, many Americans were unable to make mortgage payments and subsequently lost their homes to foreclosure. We estimate that between 2007 and 2010, there were approximately 3.8 million foreclosures.1
In this Chicago Fed Letter, we address these questions by using data on a large sample of individuals who experienced a home foreclosure after 2000, with a focus on those who entered foreclosure between 2007 and 2010. We use credit bureau data through 2016 from the Federal Reserve Bank of New York Consumer Credit Panel/Equifax (CCP) database. We build on prior work by Brevoort and Cooper,2
who also used the CCP database but whose analysis ended with 2010 data. Their study showed that prime borrowers (i.e., borrowers with credit scores 660 and above3) who had experienced a home foreclosure during the Great Recession were especially hard hit and that their rate of recovery was significantly slower relative to such borrowers who had experienced a home foreclosure earlier in the decade. We extend Brevoort and Cooper's analysis through the second quarter of 2016 in order to examine how these patterns evolved over the subsequent years of the economic expansion. Specifically, we examine the entire trajectories of credit scores and credit delinquencies starting from the years before a foreclosure event and also extending many years after foreclosure. We also examine whether borrowers obtained a new mortgage in the years after foreclosure.
Foreclosures surge during the great recession
Our data are based on a 5% random sample of the population with credit bureau reports from the CCP database. These data allow us to study patterns in the number of new foreclosures ("foreclosure starts") each quarter beginning with the first quarter of 2000. Figure 1 shows that foreclosure starts were fairly steady until around the end of 2006. They then began to surge in 2007, peaking in 2009. After 2010, foreclosure starts began to rapidly decrease; by the end of 2012, the number of new borrowers entering foreclosure returned to pre-crisis levels.
1. Foreclosure starts, by home mortgage borrower credit status
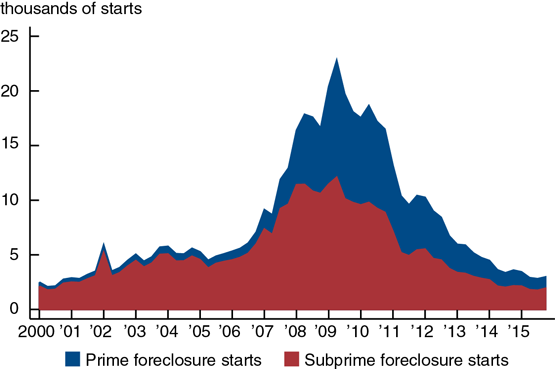
Source: Authors’ calculations based on data from the Federal Reserve Bank of New York Consumer Credit Panel/Equifax.
Before the Great Recession, the majority of foreclosure starts were among subprime borrowers (i.e., those whose credit scores were below 660 4
Figure 1 shows that the Great Recession led to a striking change in the composition of foreclosures between prime and subprime borrowers. According to our analysis, from 2007 through 2010, foreclosures rose approximately 800% among prime borrowers, but only 115% among subprime borrowers. Over the same period, 40% of all foreclosure starts were among prime borrowers and 26% were among borrowers whose pre-delinquency credit score (see note 4) was over 700. This is one defining characteristic of the Great Recession: A much broader range of individuals, including those who had very high credit scores, were swept up in the collapse of housing markets. Indeed, while the overall level of foreclosure starts has come back down to pre-recessionary levels, the fraction of prime borrowers in foreclosure remains relatively higher than it did before the downturn.
The decline in credit scores at foreclosure
As might be expected, once borrowers enter foreclosure, their credit scores plummet. Figure 2 shows that the declines were very large for both prime and subprime borrowers during the Great Recession (solid lines). The decline in the average score for prime borrowers was about 175 points, and subprime borrowers experienced a decline of about 140 points in their average score.5 Immediately after foreclosure, nearly all borrowers became subprime, with average scores of around 550 for previously prime borrowers and 475 for already subprime borrowers. These declines were a bit larger than those experienced by borrowers who foreclosed between 2000 and 2006 (dashed lines).
2. Credit scores of home mortgage borrowers relative to foreclosure start
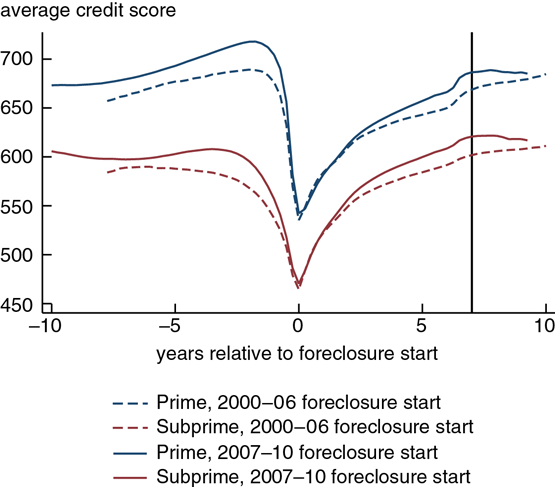
Source: Authors’ calculations based on data from the Federal Reserve Bank of New York Consumer Credit Panel/Equifax.
Recovery after foreclosure
By law, information about any credit payment delinquencies, including mortgage payment delinquencies, must be removed from an individual’s credit record after seven years. Therefore, we would expect that if no other delinquencies occurred, individuals who experienced a foreclosure should see their credit scores recover in seven years. In figure 3, we plot the cumulative fraction of borrowers who reattained their pre-delinquency credit scores (again, see note 4) in the years following a foreclosure and show this separately for previously prime and already subprime borrowers.
3. Share of home mortgage borrowers who recovered pre-delinquency credit score after foreclosure
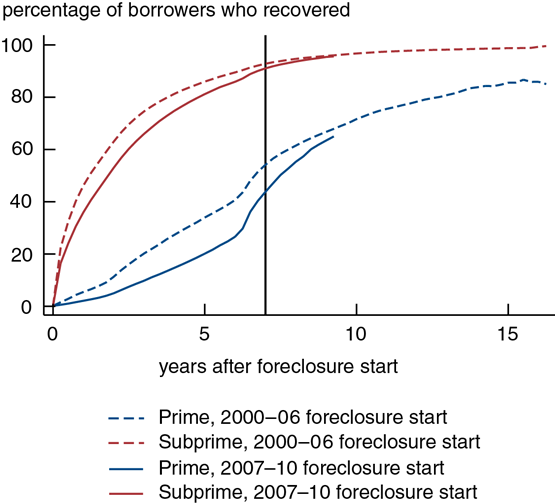
Source: Authors’ calculations based on data from the Federal Reserve Bank of New York Consumer Credit Panel/Equifax.
What is immediately evident is that subprime borrowers tend to recover their pre-delinquency credit scores relatively more quickly than prime borrowers. First, let's examine the patterns of recovery for those who foreclosed on a home before the Great Recession. Among subprime borrowers who experienced a foreclosure between 2000 and 2006, roughly 60% reattained their pre-delinquency credit scores at some point within two years of foreclosure and roughly 85% within five years of foreclosure. In stark contrast, only about 10% of prime borrowers who foreclosed on a home in the same period recovered within two years and only about 33% within five years. After seven years, when delinquency flags are removed from their credit reports (as indicated by the black vertical line), about 90% of these subprime borrowers have reattained their pre-delinquency credit scores, compared with only about 50% of prime borrowers. After 15 years, nearly all subprime borrowers have reattained their pre-delinquency credit scores, whereas about 15% of prime borrowers have still not fully recovered. (Of course, subprime borrowers have a much lower pre-delinquency credit score to return to.)
When we examine the experience of the huge wave of borrowers who lost their homes to foreclosure during the Great Recession, we see a much slower pace of recovery. Specifically, among those who experienced a foreclosure between 2007 and 2010, irrespective of their credit status (prime or subprime), the pace of recovery was slower in the first three to five years after foreclosure relative to the pace of recovery among those who experienced a foreclosure in earlier years. However, after seven years, the subprime borrowers who foreclosed on a home in 2007–10 were virtually on track with their predecessor cohorts in terms of recovering their pre-delinquency credit scores. In contrast, even after seven years, prime borrowers who experienced a foreclosure in 2007–10 continued to lag their predecessor cohorts in reattaining their pre-delinquency credit scores. By 2016, the prime borrowers who entered foreclosure between six and nine years earlier (in 2007–10) appear to have recovery rates that are converging with the historical rates of recovery among their predecessor cohorts. When we further break down the analysis by subgroups of prime borrowers (660 to 700, 700 to 750, 750 and higher), we find that the lack of full recovery is mainly driven by those prime borrowers with the highest credit scores before foreclosure.
Other delinquencies and measures of financial health
A possible explanation for the slower pace of recovery among those who entered foreclosure between 2007 and 2010 relative to predecessor cohorts is that these individuals encountered difficulties paying their credit obligations on time because of the severity of the Great Recession. Since payment history is a critical component of credit scores, this could explain the especially slow rates of recovery. To address this possibility, we examine delinquency rates on any credit obligations for home mortgage borrowers before and after a foreclosure.
In figure 4, we plot the share of individuals who were 90 days or more past due on one or more sources of credit, including first mortgages, credit cards, and auto loans. Among both prime and subprime home mortgage borrowers, the share with credit delinquencies spikes to roughly 100% at the time of foreclosure and then drops sharply thereafter. Among those who entered foreclosure between 2000 and 2006, the share of prime home mortgage borrowers who are delinquent on their credit obligations tends to decline quite quickly, but never gets back down to the pre-foreclosure levels. Among subprime borrowers, the fraction of those who are delinquent takes much longer to fall, but does eventually get much closer to pre-foreclosure levels.
4. Share of home mortgage borrowers 90 days or more past due on a credit obligation
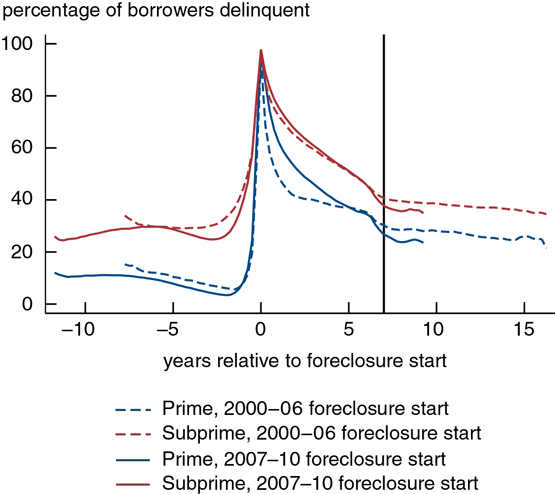
Source: Authors’ calculations based on data from the Federal Reserve Bank of New York Consumer Credit Panel/Equifax.
We find that for the first seven years following foreclosure, the share of individuals who were delinquent on any credit obligations among those who experienced a home foreclosure in 2007–10 generally remained higher than this share among those who experienced a home foreclosure in 2000–06. This was the case regardless of the credit status (prime or subprime) before foreclosure. However, after seven years, this pattern reversed.
Implications for the housing market
A question of interest is how the experience of foreclosure has affected housing markets. In figure 5, we show the cumulative fraction of individuals who experienced a home foreclosure but who then managed to take out a new mortgage afterward. When looking at the historical experience of prime home mortgage borrowers who entered foreclosure between 2000 and 2006, we find that just shy of 40% took out a new mortgage in the seven years following. The comparable value for subprime borrowers is notably lower, at around 30%. Among those who foreclosed on a home between 2007 and 2010, the shares with new mortgages seven years after foreclosure are dramatically lower at just over 25% for prime borrowers and just under 17% for subprime borrowers.
5. Share of home mortgage borrowers with a new mortgage after foreclosure
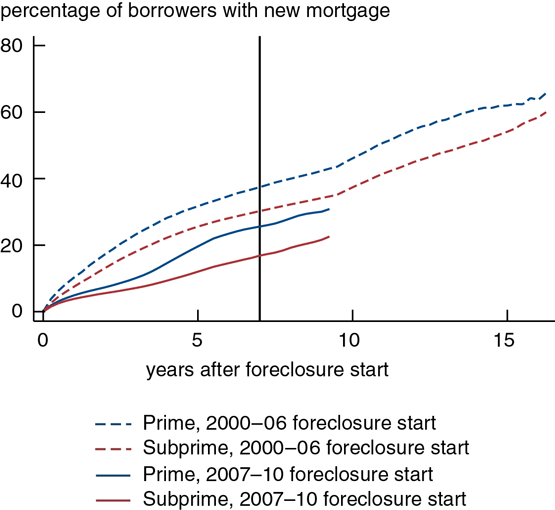
Source: Authors’ calculations based on data from the Federal Reserve Bank of New York Consumer Credit Panel/Equifax.
These findings suggest that even though the overall credit scores and shares of delinquent borrowers appear to have returned to levels closer to historical norms for individuals who experienced a foreclosure in 2007–10, their homeownership rates continue to considerably lag the homeownership rates of those who experienced a foreclosure in 2000–06. The slower financial recuperation of those who lost their homes to foreclosure during the Great Recession has been one important factor behind the slow recovery in housing markets during the current economic expansion.
Summary
By tracking a sample of home mortgage borrowers who entered foreclosure in 2000–06 and 2007–10, or before and during the Great Recession, we find that the pace of recovery in credit scores was slower in the first few years after foreclosure for the latter cohorts. We also find that prime borrowers who experienced a foreclosure during the downturn were especially hard hit and had the most difficulty recovering. Overall, at least 15% of all prime borrowers have permanently lower credit scores regardless of when they foreclosed on their homes. A significant factor behind the slow recuperation in credit scores for borrowers who lost their homes to foreclosure in 2007–10 was adverse economic conditions during the recession, which led to delinquencies on other credit obligations. The slow rehabilitation of their financial health helps explain the slow recovery in housing markets post-recession. Indeed, following foreclosure, these borrowers have considerably lagged their predecessor cohorts in terms of homeownership rates.
1 Authors’ calculations based on data from the Federal Reserve Bank of New York Consumer Credit Panel/Equifax (CCP) and statistics from RealtyTrac (as cited in http://blog.credit.com/2015/04/boomerang-buyers-is-there-homeownership-after-foreclosure-114803/). Because of the high incidence of foreclosures in 2010, we include them in our analysis of foreclosures during the “Great Recession.” The recession officially ended in 2009 according to the National Bureau of Economic Research.
2 See Kenneth P. Brevoort and Cheryl R. Cooper, 2013, "Foreclosure's wake: The credit experiences of individuals following foreclosure," Real Estate Economics, Vol. 41, No. 4, Winter, pp. 747–792.
3 Credit scores (FICO scores) have a range of 300–850; for more details, see http://www.myfico.com/credit-education/credit-scores/.
We categorize prime and subprime foreclosures based on the credit score of the borrower (prime, 660 and above; subprime, below 660) in the nearest quarter in which there is no major mortgage delinquency (i.e., less than 30 days past due) before the foreclosure start. In the text, we refer to this particular measure of the credit score as the "pre-delinquency credit score."
We calculated these declines by taking the difference between the peak average credit score before foreclosure and the average credit score at the time of foreclosure.
I have a copyright, too, you know.
Voting is beautiful, be beautiful ~ vote.©
5 comments:
I failed to mention that fake ass Detroit Land Bank Authority, but that is why I filed a False Claims Case.
This popped up and I was traumatized because of all the intellectually purile politicals pundits talk dumb stuff about Detroit, while looking even dumber for never mentioning the two ensconced, island cities of Hamtramck and Highland Park.
To quickly identify Detroit and Michigan productive modeling crap studies in 15 seconds or less...
If Highland Park, Hamtramck are not represented by data, then the entire study is fake.
No mention of the fake ass water shut offs.
No mention of the urban pioneers send foreign privateers who swooped in and received these stolen homes in other mortgage fraud schemes.
Post a Comment